Cruising to a Soft Landing

What You Missed
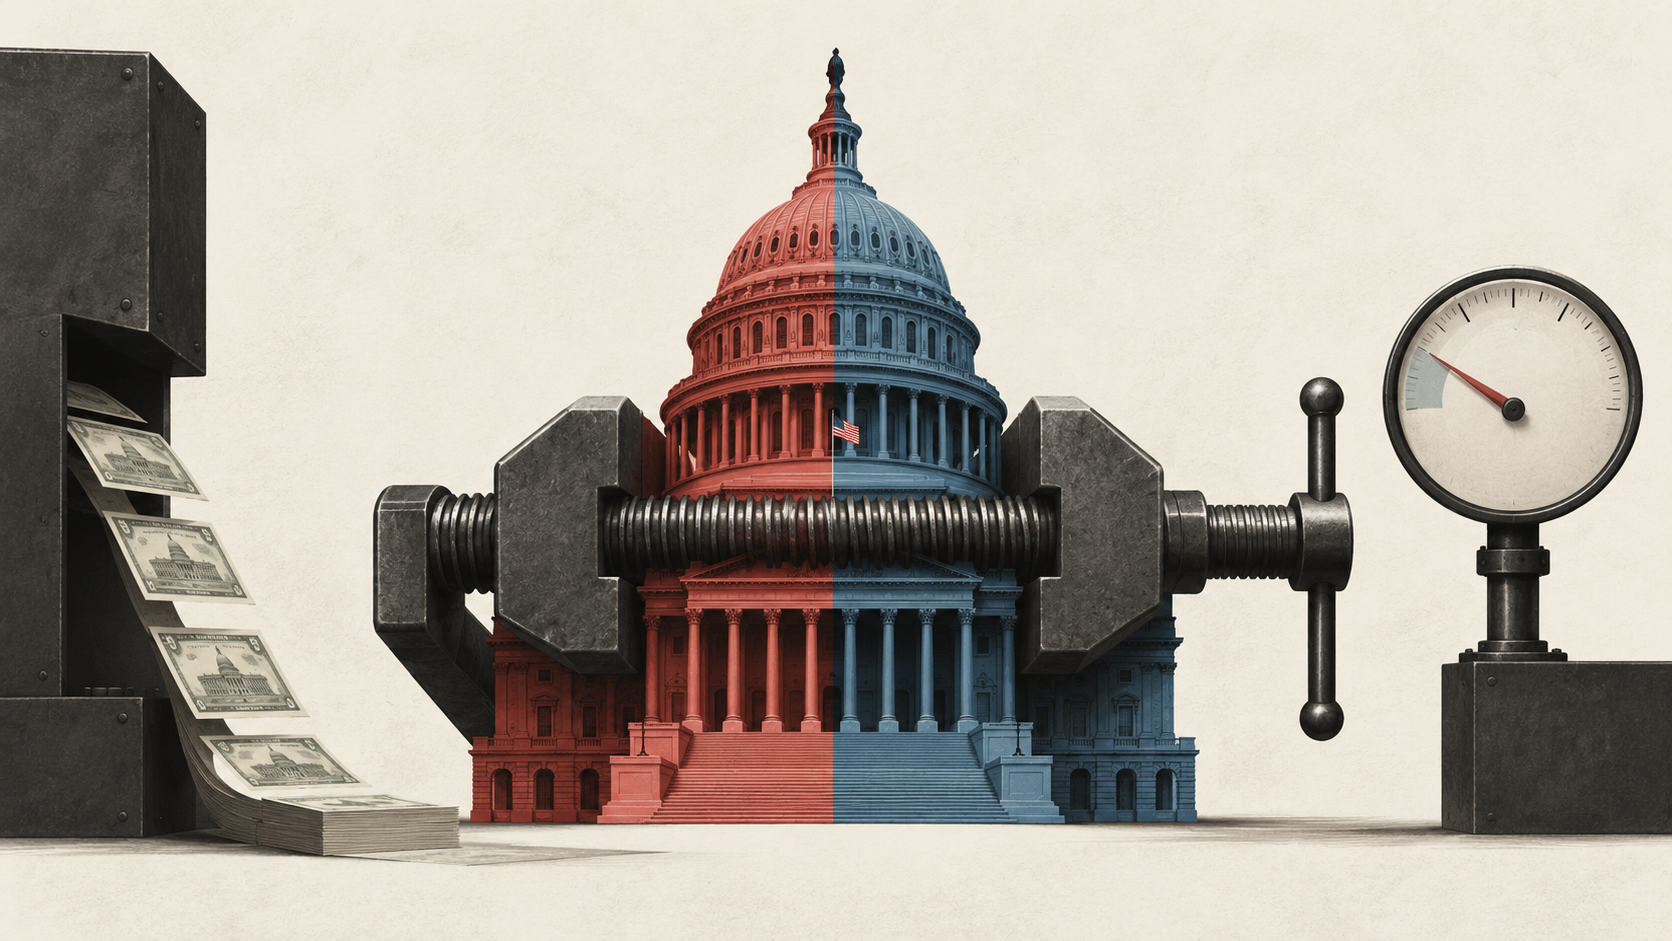
Following positive data releases signaling a surprisingly strong US economy, short-term Treasury yields surged, wrapping the week close to levels last seen before the stock market selloff / yield collapse a couple of weeks ago. The move reflects greater caution among financial markets about the possibility of an outsized Fed rate cut at its September 18th policy meeting. With everyone and their dog expecting at least a 0.25% rate cut next month, the question now is how much the Fed will cut and where interest rates will settle once they stop.
Running the Numbers: Short-term Yields Glide Higher as Recession Fears Collapse
Looking for current market rates and historical interest rate data? Check out our Interest Rate Dashboard.
The increase in yields was led by the 2-year Treasury note, which surged 16 basis points mid-week to approximately 4.12% following positive reports on retail sales and weekly jobless claims. The 2-year has since settled lower, near 4.07%.
Interest-rate cuts are now firmly in the cards for financial markets, and recession has replaced inflation as the dominant concern. Bond markets now expect ninety-two basis points in cuts for the remainder of 2024, slightly lower than the previous estimate of over 100, with rate cuts at each of the Fed’s September, November, and December Fed meetings.
What? 1% in cuts, all before the new year? Could it happen? Don’t count on it. Rates markets have overshot in both directions multiple times this year, only to get caught wrong-footed when the economy didn’t follow recession predictions or when inflation or the jobs market didn’t behave as expected. This underscores the need for extreme caution in interpreting market movements and the paramount importance of careful analysis. Our recent Q3 Interest Rate Forecast webinar explored this concept in detail. Did you miss it? You can download the slide deck and watch the replay HERE.
For the week:

Where will SOFR be a year from now? 3-month SOFR, a valuable gauge for the true cost of interest rate hedging, rose one basis point to 5.13%. The implied yield on the 3-month SOFR futures contract 1-year forward (September ‘25), an estimate of where markets expect 3-month Term SOFR – and by extension, hedging costs – to be a year from now, rose 8 basis points week-over-week to 3.40%, reflecting higher Treasury yields and the financial market’s continued U-turn on expectations of a near-term economic recession.
When will SOFR Fall? 1-month SOFR, via the SOFR forward curve, implies that one-month SOFR has peaked near 5.33% and will decline precipitously over the next year as the Fed eventually cuts interest rates in September. The forward curve projects that 1-month Term SOFR will steadily decline from here, eventually bottoming out near 3.11% in February 2027. That’s down seven basis points from last week.
Where is the 10-year Treasury yield headed? The 10-year Treasury forward yield curve implies the yield will bottom out at 3.80% (versus 3.89% this time last week) in February 2025 and then stage a slow and steady sequential rise. The 10-year yield is likely to correct higher over the course of this week on the back of comments by Fed Chair Powell (see below). With all the US Treasury’s debt issuance on tap in the coming quarters and a consistently resilient economy, it’s tough to imagine a 10-year Treasury yield sustainably below 4.00%.
While the forward curves for SOFR and Treasury yields aren’t great forecasts – they’ve proven to be horrible predictors historically – they give one a peek at the market’s current thinking.
When will rate cap costs decline? Rate volatility, a vital driver of the cost of option-based interest rate hedges like rate caps, continued its retreat to a two-week low. As such, rate cap costs are again moving lower, trading 25-30% below their recent peaks.
Are you eyeing a near-term rate cap extension or replacement? You should re-price that rate cap now. Check out our rate cap calculator or email us to learn more.
Elsewhere, equities were substantially higher on the week on signs that US inflation continues to recede while growth remains moderate. A barrel of West Texas Intermediate crude fell $3.41 to $76.65 as financial markets calmed. The US Dollar weakened on bets of extreme interest rate cuts, and Gold strengthened.
Despite Lower CPI, Fed’s Favorite Inflation Gauge is Set to Rise
In July, the headline Consumer Price Index (CPI) increased by 0.15% (versus -0.06% in June), while the core CPI, which excludes volatile food and energy components, rose by 0.17% (versus June’s +0.06%). The year-over-year headline decreased slightly to 2.9% (versus June’s 3.0%), its lowest level since March 2021 – while the core rate dropped to 3.2% (versus June’s 3.3%). All good news for Fed watchers and those praying for rate cuts.
The annualized changes in core CPI for the one-, three-, and six-month periods – useful for gauging inflation’s momentum – were 2.0%, 1.6%, and 2.8%, respectively, versus the 0.8%, 2.1%, and 3.3% seen in June. The one – and three-month periods align with the Fed’s 2% inflation target, while the third one is closer to it. Again, good news and probably enough, at least on the inflation front, to nudge the Fed toward a 0.25% rate cut next month.
What’s driving inflation lower? Car prices mostly, posting a 2.3% decrease on a seasonally adjusted basis (compared to June’s -1.5%), while new-car prices experienced a slight decline of 0.2% (the same as June).
For our commercial real estate readers, July’s CPI data release brought some good news overall on inflation but showed an unusual rent surge; primary rents rose 0.5% (vs. 0.3% in June) and a 0.4% gain (vs. 0.3% prior) in owners-equivalent rent (OER); both sharply higher than last month. Annualized, shelter inflation dropped to 5.03%, the lowest since March 2022, while Owners’ Equivalent Rent (OER) cooled to 5.30%.
All told, shelter inflation – CPI’s largest component – is expected to continue significantly driving disinflation throughout the remainder of the year. It is expected to fall to somewhere near 4.0% (annualized) in December, helping to clear the path for a December rate cut. For context, when excluding the shelter component, CPI would have been just 1.7% in July. That tells you that higher rents and Fed rate cuts are mutually exclusive, at least for now.
Bottom line: While analyzing the CPI data is entertaining, the Fed uses the 12-month change in the core Personal Consumption Index (core PCE) to assess if it has met its inflation mandate, not the CPI. At 2.6% (June), it has logged gradual declines over the course of the year but remains well above the Fed’s 2% target. The latest measure of core PCE, for July, is set for release on August 30th.
Alongside the Producer Price Index (PPI), a measure of inflation on the wholesale level, July’s CPI data suggests that July’s core PCE is expected to remain at 0.2%, the same as June. That would increase the 12-month change in the core PCE to 2.7% (up from 2.6% in June), an upward trajectory the Fed doesn’t want to see.
Couple that with a still strong but cooling jobs market and scant signs of imminent recession, and you can see why we expect just a 0.25% rate cut in September, followed by another 0.25% in December.
Yes, that’s just half of the 100-basis point in cuts the markets are projecting over the same period, but why? The threat of high inflation still exists. The US economy keeps proving its resilience, which is evident in the robust retail sales figures for July (see below), shaky US-China trade tensions, shipping disruptions, increased public spending, and turmoil in the Middle East all keep the risks of inflation alive. As such, the Fed will remain cautious, cutting rates slowly and incrementally over a long period of time.
Robust Retail Sales Prove Economic Resilience and Keep Inflation Threat Alive
Retail sales for July increased by 1.0%, the strongest reading since January 2023, surpassing consensus expectations of a 0.4% rise. Excluding cars and gasoline, sales rose 0.4% (vs. 0.8% prior). Excluding vehicles, gas, food services, and building materials, control-group sales increased by 0.3% (compared to 0.9% previously), surpassing consensus expectations of 0.1%.
Our take: Consumers, who alone drive over 70% of all US economic activity, prioritized essential purchases and sought out online discounts during the month of July. When viewed in the context of weak fundamentals, this behavior indicates one set of consumers under increasing financial strain rather than one who is resilient. Given the slowing jobs market, it is likely that consumer spending will remain limited to specific areas while discretionary spending will continue to slowly decline.
But remember, like it or not, we live in a two-tiered economy. One set of households owes money and is suffering more from the impacts of high interest rates. The other set, those that own assets, have never been in better financial shape than they are today. We suspect those asset-owning households are driving most of the spending, keeping the economy humming and delaying the need for outsized Fed rate cuts, even with a slowly weakening jobs market.
What to Watch: J-Hole Takes the Spotlight
The most significant event this autumn won’t be the US presidential election, expanding conflict in the Middle East, the Ukrainian conflict, or Elon Musk’s tweets. It will be the first Fed rate cut, the first since the start of the Covid pandemic in March 2020, which is far more significant for most Americans. Our expectation of a measly 0.25% cut on September 18th won’t do much to lower the cost of eggs or businesses’ hiring strategies. However, it will serve as a significant indicator of the upcoming phase of the monetary policy cycle, which will have noteworthy implications for the economy, financial markets, and consumers.
Will the Fed cut rates to rescue the economy from a recession or merely normalize rates that have grown too restrictive? Fed Chair Powell & Co. face a quandary: if it doesn’t cut enough during this easing cycle, the economy could slide into a recession. If it cuts too much, too fast, there is a risk of reigniting inflation and potentially triggering a speculative market frenzy. Should the Fed get it just right – threading the needle as it has done thus far – it may achieve a desirable outcome – aka a “soft landing” – where the economy continues to grow optimally, avoiding the risks of recession or significant inflation.
Currently, there are zero reasons for the Fed to cut rates aggressively. Examining the most recent daily and weekly data reveals positive trends across various sectors. Retail sales are robust, jobless claims are decreasing, restaurant bookings are thriving, air travel is flourishing, hotel occupancy rates are high, bank credit growth is picking up pace, bankruptcy filings are on a downward trend, credit card spending is steady, and Broadway show attendance and box office revenues are impressive.
Zooming out, the Atlanta Fed’s estimate for third quarter GDP is 2.0%, while the Dallas Fed’s weekly GDP indicator stands at 2.2%, both respectable growth rates, with no real hint of a looming recession. The St. Louis Fed’s Price Pressures Index remains very elevated, in contrast to the market’s view that the Fed’s inflation fight is over. Lastly, the Chicago Fed’s National Financial Conditions Index still shows financial conditions being quite loose. Taken together, these measures are not conducive to an outsized rate cut this year, in September or otherwise. As such, the market’s extreme rate-cut wagers will be scaled back.
The Fed Chair will get his next opportunity to lay the groundwork for rate cuts this week at the annual Jackson Hole Economic Policy Symposium. During his keynote address on Friday, August 23rd, he’s expected to reiterate that the Fed’s decisions are data-dependent while hinting at near-term rate cuts but will go out of his way to temper expectations of an outsized (0.50%) September cut. As such, expect Treasury yields to rise on Friday as aggressive rate cut hopes deflate.
As risk management advisors, it is becoming increasingly important to discuss what the easing cycle will look like after the September rate cut. According to the Fed’s most recent Summary of Economic Projections, released after the June Fed meeting, the Fed suggests gradual rate cuts of a quarter-point per quarter until the end of 2026. This would result in a longer-term, “neutral” fed-funds rate – that neither stimulates nor restricts economic activity – of 2.8% (it’s 5.50% now). We’re betting that it ends up higher than that, somewhere near 3.5% (that implies 2.00% in rate cuts), mainly due to America’s economic resilience and lingering factors that could stop the Fed’s inflation progress in its tracks. An update to the Fed’s economic projections will be released at the September meeting.
The next big data point that will exert the most influence on the Fed’s rate-cutting path is the August jobs report, set for release on Friday, September 6th. The data will show whether the jump in the unemployment rate to 4.3% in July was just a blip or something more sinister, requiring a more aggressive rate-cutting response by the Fed.
10 Myths and Misconceptions: Interest Rate Swaps
We’re seeing more and more instances of bank fianancing that involve interest rate swaps. We’re also noticing that borrowers have no idea of what they are getting into, and it’s time to break down, once again, the the massive risks involved with swaps and what borrowers always get wrong.
Click to check out our Market Data pages and Calculators
• Interest Rate Dashboard
• Forward Curves
• Interest Rate Cap Calculator
• Defeasance Calculator
• Yield Maintenance Calculator