Well, that Was Fun!


What You Missed
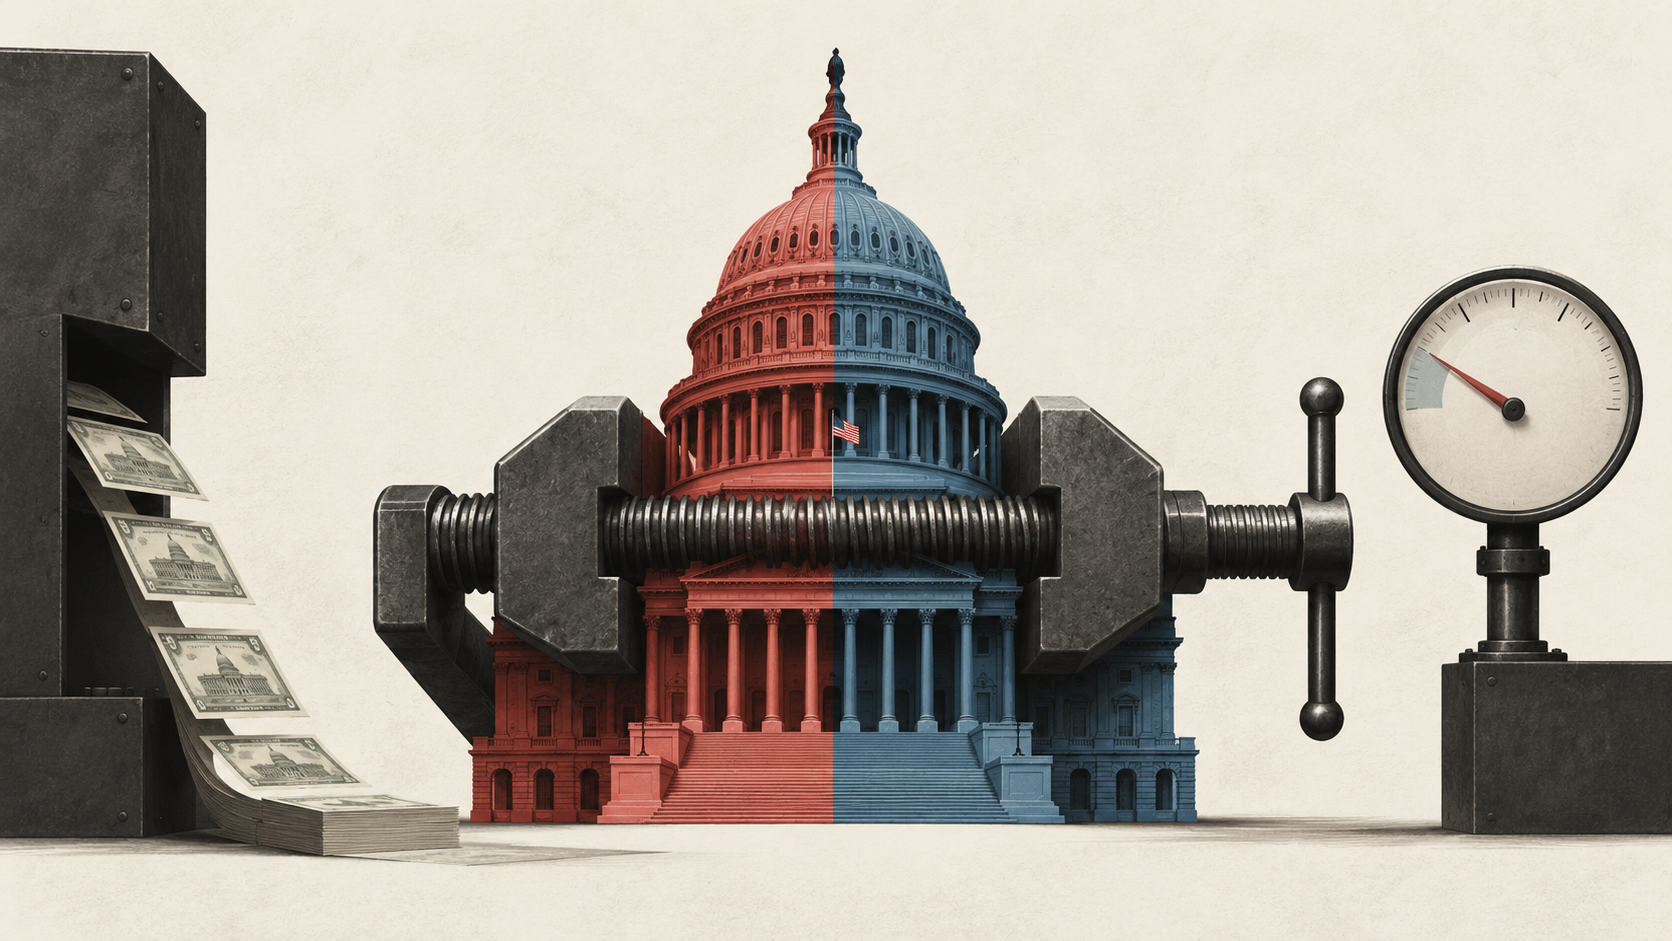
Markets were coaxed off the ledge by better-than-expected economic data in the past week, reframing the steep declines in Treasury yields seen early last week as an overreaction and that the economy isn’t on the brink of a recession but rather experiencing a moderate slowdown. The ultimate takeaway: The revival of the economic soft-landing narrative underscores its resilience. The billion-dollar question now: Will market expectations of over 100 basis points in rate cuts before year’s end survive the looming release of inflation and jobs data?
Running the Numbers: Yields U-Turn After Recession Fears Prove Overblown – Again
Looking for current market rates and historical interest rate data? Check out our Interest Rate Dashboard.
Treasury yields staged a U-turn last week, erasing most of their precipitous declines which were driven by concerns that the Fed’s aggressive monetary tightening was dampening the economy. In the end, solid economic fundamentals dominated, pulling markets back from the edge.
For the week:

As we stated this time last week, the huge moves lower in yields weren’t justified. Rates markets have overshot in both directions multiple times this year, only to get caught wrong-footed when the economy didn’t follow recession predictions or when inflation or the jobs market didn’t behave as expected. Our recent Q3 Interest Rate Forecast webinar explored this concept in detail. Did you miss it? You can download the slide deck and watch the replay HERE.
With all eyes on this week’s latest inflation data – see below – which markets hope will provide the Fed with the ammunition it needs to begin cutting interest rates at its next meeting in September, the summer of Fed guessing is getting closer and closer to its crescendo.
Zooming out, after last week’s craziness, debt traders are showing a bit less immediate anxiety, but they’ll remain on edge for the uncertainties swirling around the next two Fed meetings and the US election. That means that Treasury yields will remain jumpy around economic data releases, Fed speeches, and other triggers for the next few months. As such, rate volatility is likely to remain elevated, slowing any real decline in the cost of interest rate caps.
Let’s break it down.
Where will SOFR be a year from now? 3-month SOFR, a valuable gauge for the true cost of interest rate hedging, fell two basis points to 5.11%. The implied yield on the 3-month SOFR futures contract 1-year forward (September ‘25), an estimate of where markets expect 3-month Term SOFR – and by extension, hedging costs – to be a year from now, rose 19 basis points week-over-week to 3.38%, reflecting higher Treasury yields and the financial market’s U-turn on expectations of a near-term economic recession.
When will SOFR Fall? 1-month SOFR, via the SOFR forward curve, implies that one-month SOFR has peaked near 5.33% and will decline precipitously over the next year as the Fed eventually cuts interest rates in September. The forward curve projects that 1-month Term SOFR will steadily decline from here, eventually bottoming out near 3.18% in November 2026. That’s up 19 basis points from last week.
Where is the 10-year Treasury yield headed? The 10-year Treasury forward yield curve implies the yield will bottom out at 3.89% (versus 3.77% this time last week) in February 2024 and then stage a slow and steady sequential rise. The 10-year yield is likely to correct higher over the course of this week on the back of the inflation prints (see below), settling somewhere around 4.10% at week’s end (it’s at 3.95% now). With all the US Treasury’s debt issuance on tap in the coming quarters and a consistently resilient economy, it’s tough to imagine a 10-year Treasury yield sustainably below 4.00%.
While the forward curves for SOFR and Treasury yields aren’t great forecasts – they’ve proven to be horrible predictors historically – they give one a peek at the market’s current thinking.
When will rate cap costs decline? Rate volatility, a vital driver of the cost of option-based interest rate hedges like rate caps, fell back to a four-month low, backing off the extreme market conditions early last week. Rate cap costs are again moving lower, trading by 25-30% below their peaks. Are you eyeing a near-term rate cap extension or replacement? You should re-price that rate cap now. Check out our rate cap calculator or email us to learn more.
Elsewhere, equities were modestly lower on the week, having recovered much of last Monday’s slide after recession fears and the unwinding of yen-funded carry trades peaked. A barrel of West Texas Intermediate crude rose $4.25 to $77.18 as economic growth fears gripped markets. The US Dollar traded mostly flat, and Gold strengthened.
Fed Loan Officers Survey Supports Soft Landing Narrative
The Senior Loan Officer Opinion Survey (SLOOS), a quarterly survey of ~80 large domestic banks and 24 branches of international banks, gathers information on how loan officers feel about recent and potential policy changes, the standards and terms of bank lending practices, and the state of business and household demand for loans.
The latest survey, released last Monday, showed that lending standards have tightened. Demand for commercial and industrial loans held steady, while demand for financing commercial real estate weakened. Overall, the survey results aren’t consistent with a near-term recession, in which lending standards tighten and loan demand declines.
Services Sector of the Economy Proves Resilient
The headline ISM services print for July – a measure of the health of the services (versus goods manufacturing) sector – rebounded to 51.4 (from 48.8 prior; a reading >50 implies expansion), surpassing consensus expectations of 51.
Business activity rebounded sharply, returning to expansionary territory (54.5 vs. 49.6 prior) after a paltry reading in June. New orders, an indicator of business demand, rose to 52.4 from 47.3, adding to the good vibes. In more good news, the employment subindex showed a positive turnaround, entering expansionary territory for the first time since January 2024 with a reading of 51.1 (versus 46.1 prior).
Why you should care: The service sector, which has been the main driver of US economic growth for many quarters now, shows signs of moderation. Combined with a 4.3% unemployment rate and an inflation rate nearing 2%, it is becoming increasingly clear that the jobs market won’t crater anytime soon, and the economy probably won’t fall off a cliff. However, the sharp equity market sell-off and sudden jump in unemployment have shaken the markets’ view – and the Fed’s – of how restrictive rates are for many. As such, the planets are aligning for a near-term Fed rate cut to head off any significant deterioration and keep the economic momentum going.
As such, we’re now expecting 50 basis points in rate cuts this year – 25 basis points in September, followed by another 25 in December – with 50 basis points of cuts in December in a worst-case, low-probability economic scenario.
What to Watch: Latest Read on Inflation to Put Soft Landing Revival to the Test
Here’s what we learned from a week of market volatility:
- Financial markets had extreme reactions to predictable triggers. The possibility of a surprising jump in the unemployment rate has been discussed for months. That jump triggering the Sahm rule has also been discussed for months.
- Financial markets are too wedded to the idea of an economic soft landing. Equities and credit aren’t priced to reflect the real risk of a recession, making them vulnerable to bad news.
- The Fed won’t be pushed by markets to cut rates before they feel it’s justified. It doesn’t want to be seen as bailing out risk-takers if there isn’t a pressing economic or financial system need for it. Thankfully, recessions have become rare over recent decades, partly thanks to the Fed. As such, until it’s clearer that the jobs market is truly suffering – we have only had one soft jobs report thus far – and inflation is firmly on the retreat, the Fed will take its time before pulling the rate cut trigger.
Data on tap in the coming week will again put the economic soft landing narrative at risk. Any indication of a potential increase in inflation could push yields higher.
The July readings of the Producer Price Index (PPI, a measure of inflation on the wholesale level, Tuesday) and the Consumer Price Index (CPI, Wednesday) will likely show slight declines, keeping upward pressures on yields. While entertaining, they won’t tell the real story that the Fed wants to hear most: that the core Personal Consumption Index – the Fed’s most favored inflation gauge – is declining.
To review, the Personal Consumption Expenditures Index, a widely watched gauge of prices across a wide range of consumer expenses and a reflection of changes in consumer spending behavior, rose a modest 0.1% month on month in June, a slight increase from the previous month’s revised rate of 0%. Core PCE deflator, the Fed’s preferred inflation measure, increased to 0.18% month over month in June, slightly higher than the consensus estimate. Following the revisions to the May and April prints, which increased to 0.13% and 0.26%, respectively, the 12-month rate of core PCE inflation was 2.6%.
Looking ahead, core PCE is expected to have risen to 2.74% in July (versus June’s 2.63%), its highest level since April. That outcome won’t inspire the Fed’s confidence that inflation is sustainably in retreat. It’s also wholly inconsistent with the 100 basis points in rate cuts that markets are pricing before year’s end. July’s core PCE measure will be released on August 30th. In the meantime, the climbing unemployment rate – now at 4.3%, its highest in three years – does give the Fed justification to cut 25 basis points – not 50 – at its next meeting on September 18th.
Elsewhere, the retail sales report (Thursday) for July will provide a glimpse into the consumer’s continued appetite to spend and, by extension, the likelihood of a continued soft economic landing. While we expect a modest increase in retail sales, it won’t tell the whole story. Like it or not, we live in a two-tiered economy. One set of households owes money and suffers more from the impacts of high interest rates, gradually reigning in their spending. The other set, those that own assets, have never been in better financial shape than they are today. We suspect those asset-owning households are driving most of the spending, keeping the economy humming and delaying the need for aggressive (e.g., 50 basis point) Fed rate cuts.
Outside of data, there’s a parade of scheduled speeches by Fed officials on tap. They’ll do their best to tow the line that the economic data doesn’t support an outsized rate cut anytime soon.
10 Myths and Misconceptions: Interest Rate Swaps
We’re seeing more and more instances of bank fianancing that involve interest rate swaps. We’re also noticing that borrowers have no idea of what they are getting into, and it’s time to break down, once again, the the massive risks involved with swaps and what borrowers always get wrong.
Click to check out our Market Data pages and Calculators
• Interest Rate Dashboard
• Forward Curves
• Interest Rate Cap Calculator
• Defeasance Calculator
• Yield Maintenance Calculator